
Ethereum Skyrockets 6% in ONE Day—Is This the Start of a Game-Changing Crypto Revolution?
As of now, Ethereum ($ETH) is trading around $2,460, maintaining its position near the highest levels seen since a significant breakdown in February. This surge comes amidst a broader recovery in the cryptocurrency market, where sentiment appears to be shifting in favor of buyers. The coming days will be crucial in determining whether this upward movement signifies a genuine rally or another failed attempt at a trend reversal.
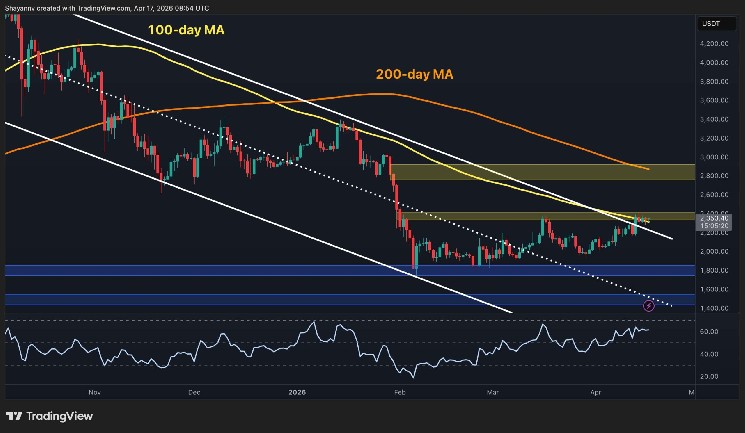
On the daily chart, $ETH has managed to break slightly above the upper boundary of a long-term descending channel and is currently testing the 100-day moving average (MA) near the $2.4k supply zone. This level has proven to be a critical resistance point over the past couple of months. The Relative Strength Index (RSI) is also trending upward in the high-50s, indicating that momentum is supporting this breakout attempt without signaling that the asset is overextended.
The key question now is whether $ETH can sustain this momentum and confirm a valid breakout above the $2.4k level and the 100-day MA. If successful, the next major resistance corridor is at $2.8k, with the declining 200-day MA (~$2.9k) situated near the upper boundary of this zone. A daily candle close above $2.4k would mark the most bullish development in months, potentially setting the stage for a climb toward $2.8k. Conversely, if momentum falters, there is a risk of falling back into the descending channel, possibly leading toward a critical support area around $1.8k.
On the 4-hour chart, $ETH has been consolidating just below the $2.3k–$2.4k resistance band for several sessions. Notably, an ascending trendline from February's lows continues to act as a support floor, currently positioned near the $2k mark. Although the price briefly surpassed the $2.4k mark, it has since pulled back slightly, indicating that the asset is solidly within the resistance zone. The RSI on this timeframe is also hovering around the mid-60s—elevated but not yet overbought—suggesting room for upward movement. Importantly, the pattern of increasingly steep higher lows on the 4-hour chart since early April contrasts with the failed recoveries seen in March, creating a more positive outlook.
The market sentiment surrounding Ethereum is also noteworthy. The 30-day moving average of the Ethereum Taker Buy/Sell Ratio has surged to approximately 1.02, marking the highest reading since mid-2023. This uptick in the ratio indicates that aggressive buyers are substantially outpacing sellers in the futures market. The timing aligns with $ETH’s approach to the $2.3k–$2.4k resistance zone, suggesting that the latest price action is being fueled by genuine demand rather than mere speculation or passive market drift.
Historically, rising taker buy/sell ratios have accompanied significant price advances, as observed during the beginnings of previous rallies. This particular reading is especially significant, as it illustrates a clear shift in the behavior of futures market participants. However, it’s essential to remain cautious; an elevated ratio can also precede short-term exhaustion if the price fails to extend beyond key resistance levels. As such, the $2.4k threshold serves as an immediate litmus test for whether the current demand translates into a lasting trend shift or leads to aggressive buying giving way to liquidation cascades.
In summary, Ethereum finds itself at a critical juncture. The current price action, supported by rising momentum indicators and strong market sentiment, suggests a potential for further gains. Yet, traders and investors alike will be closely watching the next few sessions to see if this breakout holds. The landscape of cryptocurrency trading is ever-changing, and Ethereum’s next moves could have significant implications for pricing dynamics in the near future.
Shocking Vaccine Gaps: 1 in 5 ER Patients Risk Measles Outbreak—Are You Safe?

You Won't Believe What Harry Hollines Did to Finally Get Inducted into the Colorado Sports Hall of Fame!

Parents Are Turning to Landlines—Here's Why They're Banning Smartphones for Their Kids!

Don't Miss This Epic Showdown: Can the Hornets Outsmart the Magic in a Do-or-Die NBA Clash Tonight?

Why Experts Predict This Shocking Tech Trend Will Change Your Life by 2025 – Don't Miss Out!

Mississippi Summit Exposes Alarming Truths in Digital Forensics—Are You Prepared for the Future?
You might also like: